How do I get the most out of my Dashboard?
The Trellis Dashboard allows you to gain significant insight into your farm. Keep reading to learn more about how to navigate & explore the Dashboard.
On the home screen of the Dashboard, growers and consultants can choose to view their data at a field level or a sensor level using the green menu on the left of the page.
Field-level View
The screenshot below is the field-level view of two sensor stations & one base station installed at UGA’s Irrigation Research Park.
Grouping sensors together into a field allows you to see the average soil moisture in the Field (shown by a colored circle).
The field level indicator (the color of the circle) communicates whether the field is ”wet”, “dry”, or “OK.” The number inside the circle is the average of the sensors' soil moisture tension values in the field.
The field level indicator color key is to the left of the search bar. Since the circle is blue, the field is wet.
Hardware-level View
The screenshot below is the hardware-level view of the same equipment at Stripling Irrigation Research Park.
Just like the field-view, the color of the indicator corresponds to the sensor station’s moisture level: “Wet,” “OK,” or “Dry.” The number shown is the last reported moisture reading. The color key for the indicators is directly above the table.
Signal Strength, Battery Level, Online/Offline Status
Signal Strength
At any time, you can check out the signal strength of your equipment on the Hardware page.
For sensor stations, more bars = easier communication with the base station.
For base stations, more bars = better cellular signal. If you see the bars icon with a red slash through it, it means the unit is having trouble communicating.
Battery Level
It is important to keep an eye on the battery level of your equipment throughout the season. If you see an empty battery with a red slash through it, it means the battery on your device is critically low.
Online/Offline Status
The screenshot below shows the online/offline indicator column on the Hardware page.
The color of the online/offline indicator changes based on when the hardware last reported data. See the color key below.
Sensor Details
You can see specific data for each sensor station by clicking on it's respective arrow on the far right of the Hardware page.
This action will bring you to the sensor detail page as shown below. This allows you to see the soil moisture and temperature patterns displayed in interactive graphs, recent rainfall data, and other miscellaneous details (crop type, variety, soil texture, plant date, GPS coordinates).
Soil Moisture Chart
The soil texture in which you install your soil moisture sensors determines the values of the “Wet” (blue), “OK” (green), and “Dry” (gold) zones that show up on the soil moisture chart.
The solid line shows the moisture readings of the top (shallow) sensor and the dashed line shows the moisture readings of the bottom (deep) sensor
Check out our recent blog post to learn more about how to use the data to decide when to irrigate!
Soil Temperature Chart
Our sensor stations collect temperature data at a depth 2" below the surface. You can view the soil temperature data for each sensor station, as shown below.
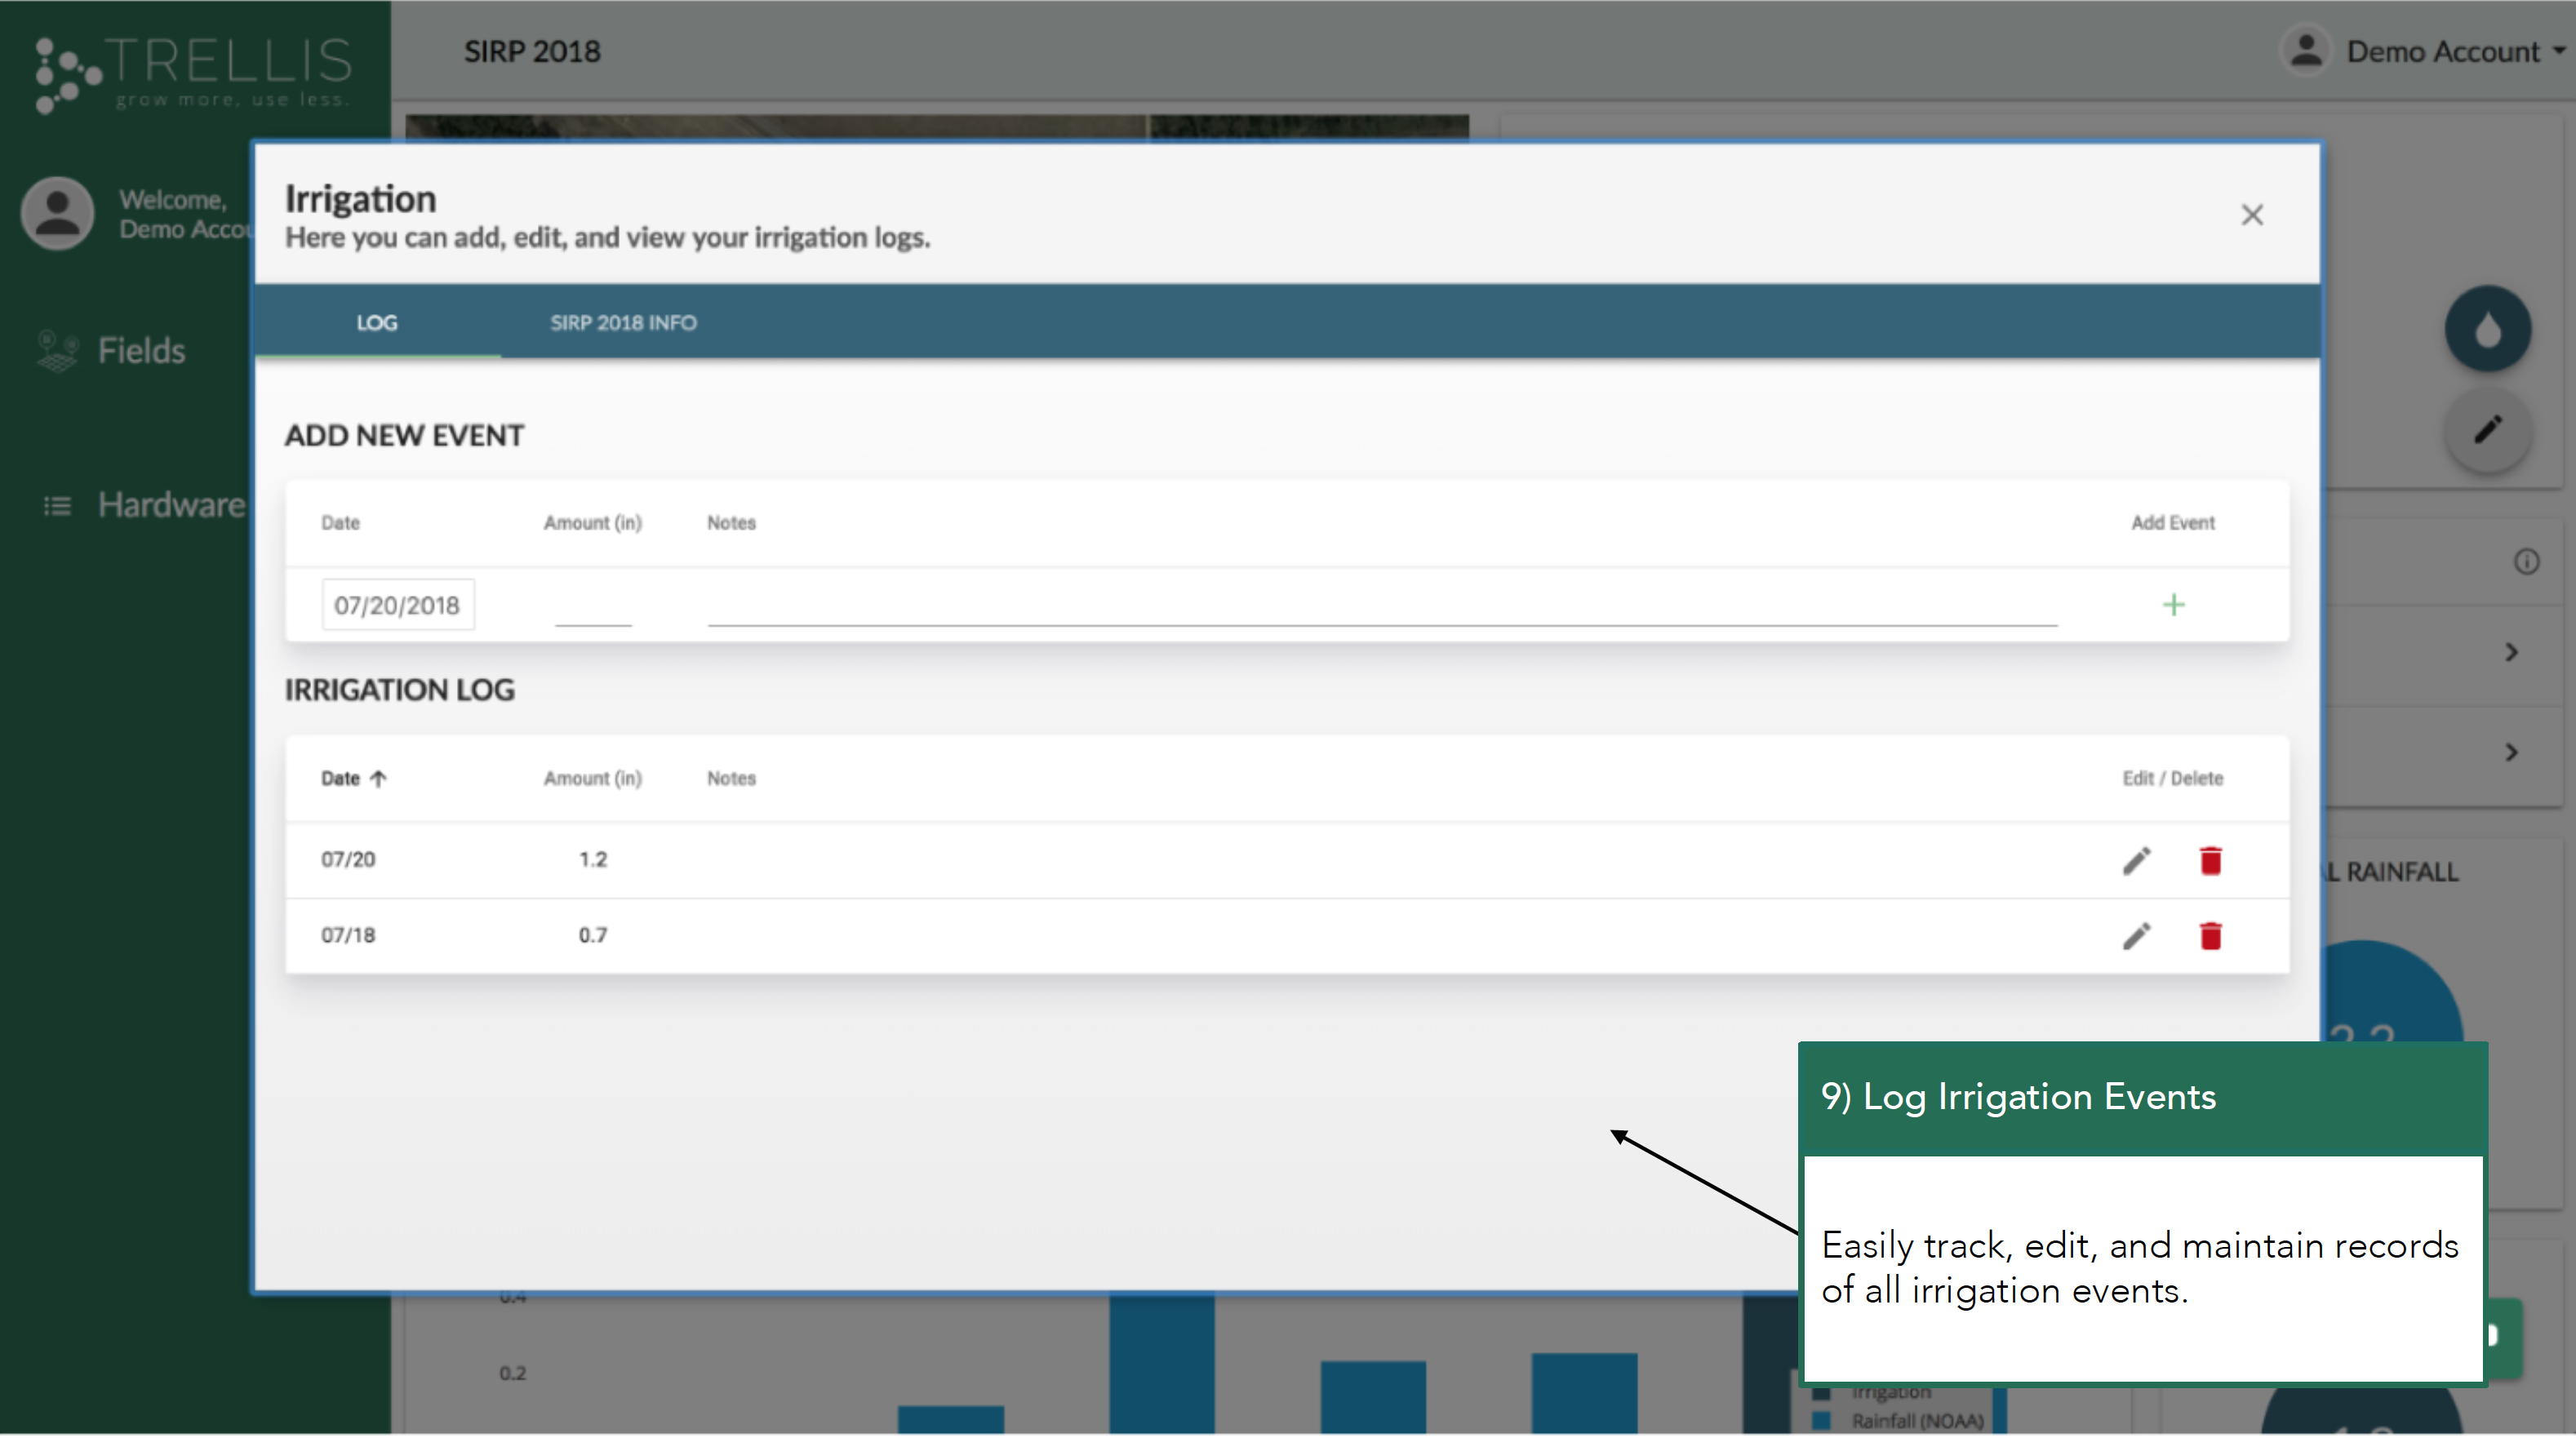
Log irrigation events
Avoid logging irrigation because it's too time consuming? Now you can log events right on the Trellis Dashboard!
Our Dashboard lets you track, edit, and maintain records of all irrigation events. Your records are safe, accurate, and always accessible through the online Trellis Dashboard.
 Irrigation Logging
Track irrigation
Stop using a notebook or a spreadsheet. Track irrigation directly on the Trellis dashboard and access records from any device.
Edit irrigation events
Easily add, edit, or remove irrigation events to more accurately record irrigation & monitor production costs.
Maintain records
Maintain records for Good Agricultural Practices (GAP), cost-sharing programs, food safety reporting & other regulatory requirements.
Get 24/7 support.
Avoid logging irrigation because it's too time consuming? Now you can log events right on the Trellis Dashboard!
Our Dashboard lets you track, edit, and maintain records of all irrigation events. Your records are safe, accurate, and always accessible through the online Trellis Dashboard.
Track irrigation
Stop using a notebook or a spreadsheet. Track irrigation directly on the Trellis dashboard and access records from any device.
Edit irrigation events
Easily add, edit, or remove irrigation events to more accurately record irrigation & monitor production costs.
Maintain records
Maintain records for Good Agricultural Practices (GAP), cost-sharing programs, food safety reporting & other regulatory requirements.
Get 24/7 support.
Have questions about the data or need technical support? Users can interact with Trellis directly for these and other needs using the built-in chat application identified in the screenshot below.
Related Articles
How do I interpret salinity on the dashboard app?
The salinity of the soil can tell you a lot about your crops. Watch the video below for a short tutorial on interpreting the salinity on the graphs page of the dashboard app.How often do you update the Dashboard / Mobile App?
The Trellis Dashboard website/mobile app is regularly updated to improve functionality, as well as to provide new features to our customers. Website changes will always be accompanied by a newsletter or email notification, explaining the changes ...What do the numbers mean on the Fields page of the Trellis dashboard app?
Watch the video below for an explanation of the numbers on the Fields page of the Trellis dashboard app.How do I rename sensor stations on the Trellis dashboard app?
Watch the video below for a quick explanation of renaming sensor stations on the graphs page of the Trellis dashboard app.What kind of weather station data can I see on my dashboard?
The Davis Weather Station provides helpful, real time data so that you can make more informed decisions when it comes to irrigating your crop. The video below highlights the key features of the Weather Station and how the data is shown on the ...